|
Category:
Flash Drives
|
|
|
Date:
19/12/2005
|
|
Author:
Michele Madonna
|
|
Manufacturer:
Crucial
|
 3.0 Performances Analysis
Each drive was tested in a variety of scenarios as well with different file system such as the old FAT16, FAT32, and NTFS. We tested on two kinds of hardware and USB hubs.
3.1 Testing Systems
The following systems were used for our testing:
 A desktop pc with this hardware setup:
Motherboard Asus P4S533 with USB 1.1 Controller;
Intel Pentium 4 Processor 2400 Mhz; 1 Gb Ram DDR 400Mhz; 2 HD Maxtor 6E040L0 40 GB.
Its software profile was:
MS Windows with Service Pack 2, MS Windows Vista Beta 1, Suse Linux 9.3 (kernel 2.6.2); SiSoftware
Sandra Lite Unicode (Win32 x86)
2005.1.10.50; Only system processes running while measuring.
A HP Compaq nx9010 notebook pc with this configuration:
Intel Celeron processor 2600 Mhz; 1 HD Sony 40 Mb; Integrated Usb 2.0 Controller.
Its software profile was:
MS Windows with Service Pack 2, Suse Linux 9.3 (kernel 2.6.2); SiSoftware
Sandra Lite Unicode (Win32 x86)
2005.1.10.50; Only system processes running while measuring.
3.2 Results understanding
The tipical output of tools that measure performances is the
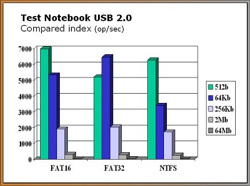
Combinated Index: the measuring take a number of steps, depending on the flash card storing space, and for each of them we evaluated the number of operations at minute in processing a file (here 512b, 32kb, 256kb, 2Mb, 64Mb files for testing the SD card).
For each file we got the output and on these partial results we operated an arithmetic mean, this one is the combinated index and it measures the system global response. Usually an output result strongly depends on many different conditions, and often a measurer can't control them unless making a statistical analysis of the results. For this reason we ran every test five times and then we calculated the combinated indices making the mean on the partial results. We will show it by Excel's histograms, without indicating the relative or absolute uncertainty. The benchmark tool we chose for testing, the Sandra Lite, showed itself very precise and accurate.
3.3 Desktop Results Analysis
This chart (figure 4) shows how units writing speed using different filesystems, tends to reduce when the file size grows.
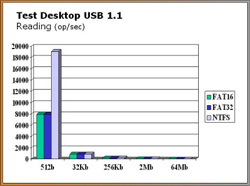
The reading speed of small files using NTFS filesystem is surprisely! With large files the difference is very slight (figure 5).
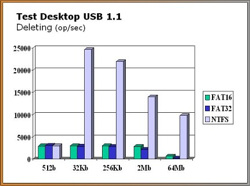
The best files deleting speed performances are achieved with NTFS file system (figure 6).
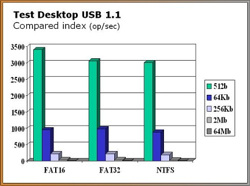
The combined index chart shows the global performances. A FAT16 filesystem is the best solution. The Gizmo! achives an index of above 3500, that is not to bad for a USB 1.1 connection (figure 7).
Even though we stressed the distances among output measures of Combinated indices (figure 7), the Secure Digital histogram shows that the performances are quite the same for the three computers, though the one based on AMD Sempron Cpu has just a little advantage on the others.
In the next page we will Gizmo! performance on notebook pc.
|

![[Figure 4 - High Resolution Image]](/images/?h=1&object=crucial_gizmo_1gb_usb_2.0_4.jpg)
![[Figure 5 - High Resolution Image]](/images/?h=1&object=crucial_gizmo_1gb_usb_2.0_5.jpg)
![[Figure 6 - High Resolution Image]](/images/?h=1&object=crucial_gizmo_1gb_usb_2.0_6.jpg)
![[Figure 7 - High Resolution Image]](/images/?h=1&object=crucial_gizmo_1gb_usb_2.0_7.jpg)